Showing posts with label climate. Show all posts

Wednesday, May 10, 2017

Skeptical Science Projects

I'm a contributor to the website Skeptical Science. Mostly I help with illustrations and when I do, I usually share the projects here. However, I've been forgetting to share lately, so this post catches up on recent projects.

This is an illustration from a post entitled A Deep Dive into Polar Ice Cores:


I had a minor confusion corrected by this post. I thought the diffusion process primarily upward when the air in snow is squeezed by the weight of more snow. Though this happens, it's not as pronounced as the diffusion between air and snow that occurs. This post was part of a new idea of answering questions posed the site from readers.

Skeptical Science also started a new project of science analogies that provide experiments or observations one can make to understand the climate system. These diagrams are from two analogies:


SkS Analogy 3: Greenhouse Effect Is Like Clouds at Night


I'm having a private Ferrari vs VW thing going.

jg


UPDATE: Some recent links to publications that mention Skeptical Science:

www.vox.com/energy-and-environment/2017/5/16/15645466/trump-fake-climate-news

http://www.nature.com/news/why-researchers-should-resolve-to-engage-in-2017-1.21236

https://www.usatoday.com/story/news/nation-now/2017/05/22/find-out-what-true-and-false-climate-change/335532001/


Wednesday, December 7, 2016

CO2 in the Air and Oceans

At Skeptical Science we started some general posts based on questions from readers. I think it's a good service. Someone asks a reasonable and thoughtful question and gets a custom essay which may include illustrations. Or first in a series is here:
(I put a diagram and an animation in this post illustrating long term storage of CO2 in the oceans.)

jg

Tuesday, October 27, 2015

Dyson's Sphere of Influence, Part 3: The Garden of Eden

(This is part 3 in a series of posts Part 1, Part 2, Part 3, and Part 4)

One thing that scientists and conservative Christians may agree on is that there was a garden of Eden six thousand years ago; however, they may not agree on it's location nor its size. The garden I speak of is what is now the Sahara Desert. Ray Pierrehumbert describes the mid-holocene climatic optimum as a time in which forests extended farther north in Europe and rivers flowed in the Sahara (Principles of Planetary Climate, Chapter 1). The wet Sahara was probably a climate response to Earth's orbital precession, Earth's wobbling top-like motion that determines how the sun's energy is distributed globally.
Regarding the wet Sahara, Dyson said:
Six thousand years ago seems to have been the warmest and wettest period of the interglacial era that began twelve thousand years ago when the last Ice Age ended. I would like to ask two questions. First, if the increase of carbon dioxide in the atmosphere is allowed to continue, shall we arrive at a climate similar to the climate of six thousand years ago when the Sahara was wet? Second, if we could choose between the climate of today with a dry Sahara and the climate of six thousand years ago with a wet Sahara, should we prefer the climate of today? My second heresy answers yes to the first question and no to the second. It says that the warm climate of six thousand years ago with the wet Sahara is to be preferred, and that increasing carbon dioxide in the atmosphere may help to bring it back. I am not saying that this heresy is true. I am only saying that it will not do us any harm to think about it. (Dyson 2007, Heretical Thoughts about Science and Society)
The statements in this passage struck me as odd. I've perused many Holocene climate reconstructions and I didn't recall any prominent global spikes in temperature from this period, but my knowledge is incomplete. As a check on my memory, I consulted some graphs of ice core data plotted for Greenland and Antarctica and confirmed that nothing exceptional affected Greenland and Antarctica:


Sunday, October 25, 2015

Dyson's Sphere of Influence, Part 2

(This is part 2 in a series of posts. Part 1, Part 2,  Part 3)

I've been looking at climate modelling studies with a renewed vigor since reading Dyson's statement that projections of global warming are based on flawed climate models. It's not only Dyson's comment that provokes me. The climate models fallacy is promoted by many private interest groups trying to influence the COP21 climate talks in November. For example, the Cornwall Alliance is a group of faith-based, pro-fossil fuel, evangelicals:
Many fear that carbon dioxide emissions from fossil fuel use endanger humanity and the environment because they lead to historically unprecedented, dangerous global warming....
Computer climate models of the warming effect of enhanced atmospheric carbon dioxide are the basis for that fear. -- An Open Letter on Climate Change to the People, their Local Representatives, the State Legislatures and Governors, the Congress, and the President of the United States of America. Cornwall Alliance, 2015. 
This letter also cites a lot of inaccurate and outdated information on the instrumental record, and credits the Judeo-Christian Heritage with the rise of the modern scientific method and dismisses computer modelling as not a reliable avenue of research.

So, I want to share what fictions climate models help us to maintain, and I didn't have to dig deep for good example, rather, just open my mailbox. My most recent issue of Nature (15 Oct. 2015) reports on modelling the loss of continental ice from Antarctica:

Friday, October 23, 2015

Dyson's Sphere of Influence (Part 1)

(This is part 1 in a series of posts. Part 2, Part 2, Part 3)

I've been asked to comment on an essay by Freeman Dyson written in 2007 in which Dyson proposed some heresies about climate science. It seems unfair to criticize an essay from 8 years ago, but some of what he said was demonstrably wrong in 2007 and a recent interview from 2015 suggests his opinion hasn't evolved since then. A physicist with his reputation has the potential to influence a lot of people, so it's worthwhile to examine if his sphere of influence should extend to the realm of climate science. The recent interview with Dyson coincides with a release of a report by the special interest group The Global Warming Policy Foundation in which Freeman Dyson wrote the introduction. The latter two items appear to be in preparation for the upcoming climate talks in Paris, possibly with the goal of influencing public opinion.
Summary
This is part 1 of two or more posts in which I'm commenting on the following:
Part 1
  • Dyson should acknowledge the entire scope of climate science before downplaying it's conclusions. 
  • The greenhouse effect is often described inadequately, even by physicists.
  • Ocean acidification, a result of our rate of CO2 emissions, is a well-acknowledged problem and missing from Dyson's commentary.
Part 2
  • It's dangerous to use regional climate change to justify global climate change.
  • What does land-use management and genetic engineering offer for mitigating our CO2 emissions? 

Friday, August 29, 2014

Knowledge as a foreign, invading power

Knowledge is power, but there are people who see any application of physics, collection of data, and survey of scientific literature as foreign, and therefore they fight its presence as though it were an invading power.

Pathetic.

The Bugle is a monthly paper produced by Knight Publishing. Ad hominem attacks are an assumed risk for anyone offering an informative article. The September 2014 issue published a community forum article that confused a high school reading level with jargon and attacks me personally.

Here is the Sept 4 Community Forum by Ken Woytek:
John Garrett took great exception to my “mythical” claims of fraud in the scientific consensus of climate professionals crying Wolf over dangerous trends in global climate. His response, printed in the Aug. issue, is replete with jargonic references that only serve the unbiased reader to agree with my premise condemning the self-serving 97% of active “climatologists.”
These alarmists are simply furthering their own secure careers in bolstering the theory of  anthropogenic global warming, as they toil away measuring conditions that support their creed. Computer models so key in the mantra are man-made and undeniably reflect the bias of the developer, equally as crucial as the manmade CO2 explosion.
Have you, for example, ever had any faith in a program sponsored by the U.N., which reacts to every open argument with condemnation of the West, USA in particular, to court the majority of General Assembly members that envy and despise America? The vaunted IPCC meets regularly to rebuke our material success, without recognition of our humanitarian exceptionalism, with climate-abuse sanctions never visited upon the grossest violators in China, India, or Brazil who share our planet.
The only answers to 176 climate myths announced by Garrett that were not faith-based are those that refer to the destruction of the Amazon rain forest as a causative factor in growth of the CO2 concentrations in the global atmosphere. That massive CO2 consumer, and all smaller brethren gardens, are pivotal in the equilibrium necessary to radiate heat back into night space after earth insolation temperature rises all day, acting together with cloudless skies. All the other references paraded by Mr. Garrett are similarly flawed pseudo-science, to which he has become irrationally enamored in classic scholastic fervor colored by his political persuasion and shared by Mr. Inconvenient Gore, Sir RT Watson, and eminent scientist BH Obama.
Best regards, Ken Woytek, Menifee
What did I say to deserve such a come-uppance?

I wrote this:

The July Community Voice [by Ken Wyotek] alluded to at least a dozen climate science myths(1), too many to discuss here, so we need to start with the basics to correct the misinformation:
Predictions of global warming are based on fundamental physics. How much warming to expect from a given increase in greenhouse gases is constrained by observations, computer modeling, and past climate reconstructions(2).
Observations include surface and ocean temperatures, solar output, Earth's reflectivity, greenhouse gas and aerosol concentrations, and outgoing radiation.
When considering all of these, rising CO2 is the best explanation for a global average temperature increase of 1.44F over 150 years, a conclusion supported by 97% of climate scientists(3). For comparison, cooling of 9F gives us an ice age. Warming of 3.6F over pre-industrial climate is worrisome but possibly safe, so our current 1.44oF increase is almost halfway through our safe zone.
Observations can be compromised by small sample sizes and measurement errors; thus decade-to-hundred-year trends such as global warming can be masked by natural year-to-decade long fluctuations. It takes 30 years to see the long term rise among short-term waves; and no one region can be taken as typical of the planet as a whole.
Computer modeling tests our understanding of the underlying physics of the climate system. Models are tested against observations and past climate reconstructions. Any scientific theory is incomplete without a physics-based model. Models have even identified errors in observations(4) and have demonstrated how global warming can dry the western US while cooling the eastern US.(5)
Climate reconstructions are based on ice cores, sediments, plant residue, and cave formations. These reconstructions of past climate smooth out the short-term effects. For example, when you look at an ice core, you’re seeing hundred-year trends, not decadal trends. It is these hundred year trends that are most disturbing, for they show:
• Our climate has changed drastically due to very small but gradual changes in energy.
• Naturally occurring changes in atmospheric CO2 levels regulate global climate on thousand-year timescales.
• Warming trends invoke feedback effects that amplify the warming.
• Our current rate of warming and level of greenhouse gases have no precedent going back millions of years.
The concern for global warming will not go away because the science will not go away despite the steady stream of misinformation.
References
1. SkepticalScience: Rebuttals to 176 climate myths, http://www.skepticalscience.com/argument.php
2. Intergovernmental Panel on Climate Change, Assessment Report 5. On my entire summary of observations, modeling, and climate reconstructions, http://www.ipcc.ch/report/ar5/wg1/#.UxNwv_ldWBR
3. Environmental Research Letters, Cook et al., http://www.skepticalscience.com/tcp.php?t=home
4. Nature, Fu et al. How a long-standing discrepancy between models and temperature observations was resolved. htttp://www.nature.com/nature/journal/v429/n6987/full/nature02524.html
5. Geophysical Research Letters, Wang et al. Modeling study shows global warming influence in the 2013-2014 California drought, http://onlinelibrary.wiley.com/doi/10.1002/2014GL059748/abstract
Additional information:
For instrumental temperature records, see http://data.giss.nasa.gov/gistemp/
(I’ve created interactive version here: http://www.brightstarstemeculavalley.org/science/InstTempRecord.html
For CO2 and temperature data for the past 800,000 years, see CO2:
http://www.ncdc.noaa.gov/paleo/icecore/antarctica/domec/domec_epica_data.html
(I’ve created an interactive version here: http://www.brightstarstemeculavalley.org/science/climate.html
Questions and criticism are welcome
at my blog: http://www.brightstarswildomar.blogspot.com
John Garrett -Wildomar

I think the differences between these two illustrate the gulf between reason and ignorance in the climate debate and in many other unnecessarily politicized issues.

jg


Tuesday, July 22, 2014

Illustrations for Seal of Approval, a Article about Bio-Logging

I've had the pleasure of contributing a few more illustrations to an article on Skeptical Science. I've shared the illustrations here, but recommend the article: Seal of Approval: How Marine Mammals Provide Important Climate Data.

A summary of advances in the use of animals to carry sensors.

A summary of the data collection cycle of an ARGO ocean sensor.


A summary of the how seals contributed to our understanding of the collapse 
of an Antarctic ice shelf.

jg

Saturday, April 19, 2014

The Guardian on Climate Imbalance

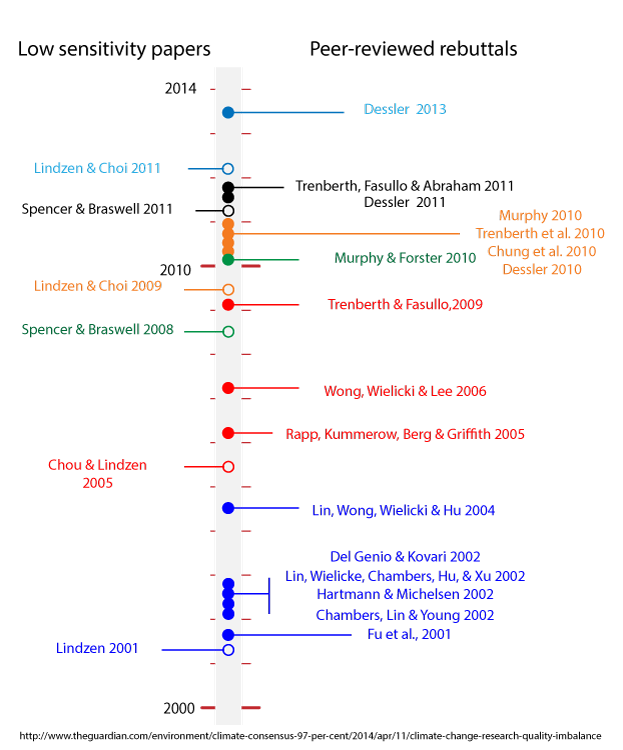
I had a minor contribution to a recent post on The Guardian: Climate imbalance. The article discusses how research addressing climate sensitivity is handled. Climate sensitivity refers to how global temperature will respond to changes in Earth's energy budget. If you double atmospheric CO2, the enhanced greenhouse effect from this change will raise the average global temperature about 1 degree Kelvin, and that rise will sustain a higher level of water vapor, which is a more potent greenhouse gas. The increased warming from CO2 and H2O will reduce ice cover, which will mean less solar energy is reflected to space, allowing for a bit more warming. Additional feedback effects will add warming and cooling influences. Climate sensitivity estimates range from 1.5 to 6 degrees K. Note that the average temperature difference between a warm inter-glacial and an ice age is about 5 degrees K, so a few degrees K represents a significant change in climate.

The Guardian reports on a review of how research on climate sensitivity has been handled in the media. Authors who are known for their low-sensitivity estimates have been exalted by some media. However, each of the low-sensitivity estimates have been rebutted thoroughly so that it would be irresponsible of any media to report low-climate sensitivity without the caveat that it's a refuted, minority opinion (very high climate sensitivity is also a minority opinion).

To help the reader sort through the various papers cited, I contributed this illustration:

Open circles are a low-sensitivity paper and the open circles of the same color or rebuttals to a paper. My original illustration was slammed on Twitter for having an unlabeled x-axis. I intended no x-axis and added horizontal spacing to stack each colored set in it's own column. The criticism of an implied and unlabeled x-axis was embarrassing but fair, and I quickly responded with an "oops, may bad; how's this new drawing?" Within the day, I had a corrected version. What I find interesting is how Twitter enabled me to communicate with a scientist who read the Guardian post and get an illustration quickly corrected.

This Guardian article came out a convenient time for me to share with my city council who are considering a climate action plan for Wildomar.

By the way, I'm on Twitter under the name @jg_to, where I'm likely to make errors and correct them again.

jg


Friday, February 14, 2014

CO2 Saturation Myth

I contributed to yet another explanation of the greenhouse effect with this post on Skeptical Science: How do we know the greenhouse effect is not saturated? I highly recommend the Skeptical Science post for those wishing to understand the behavior of the greenhouse effect. I say "behavior" because the post is not trying to explain the complete physics, which is a daunting task.

This illustration I created came about from criticism and humor. The reviewers of my illustration criticized the early sketches that showed the water tank as it is shown below, but with the Earth's surface down and energy loss shown as radiating upward -- which is how most of us think about the Earth and atmosphere: Down is Earth, up is space. The criticism was that the two illustrations had opposite directions of flow, and could I find some way to make the flow direction consistent to aid comprehension. So, in a bit of jest, since the website is Australian and I'm from the northern hemisphere, I turned the Earth and atmosphere upside down, and labeled the surface Australia. They liked it, so here it is:


See the original post for a complete explanation written by Skeptical Science author Glenn Tamblyn.

jg

Tuesday, January 7, 2014

Our great landfill in the sky

I have two projects related to the atmosphere serving as a dump for our emissions. One, my usual topic, is about our CO2 emissions. For this, I've been working on some illustrations with the Skeptical Science team displayed in a post Talking Trash on Emissions by Andy Skuce and me:


These illustrations are based on a statistic by Professor Richard Alley that our emissions in CO2 are about 40 times the weight of our household trash. Both illustrations are available in a large format in the Skeptical Science graphics resources.

The second landfill-in-the-sky topic came up when I learned my region was under a wood-burning restriction on New Years Eve and again on Saturday the 4th. I decided to look into the history of this restriction put in place by the South Coast Air Quality Management District. Primarily, I want to research the scientific support for such policies, which I'm doing. This project may take a few weeks.

jg


Monday, December 23, 2013

Combating a two-decade campaign against climate science

The magazine Europhysics News has published an article by Skeptical Science founder John Cook on the anti-science campaign against climate science. I created an illustration the cover page, which I've shown here:


The article is open access:
Combating a two-decade campaign attacking the Scientific Consensus on Climate Change

jg

Thursday, November 28, 2013

Global Warming Heat Widget at Skeptical Science

My friends at Skeptical Science have produced a web gadget, global warming counter, that can be embedded on blogs and websites, as I have done here for the right panel. The counter is a reminder that global warming is about the total heat in the climate system that is accruing mainly in the oceans, probably due to the dominance of la Nina conditions over the past decade. It is also possible that surface temperature stations fail to sample the poles adequately, which is where warming is expected to be more abrupt. Many skeptics have have pointed out the slow rise in surface temperatures (or lack of rise, depending on which data set is their favorite) over the past 15 years and proclaimed that global warming has stopped. The kindest response to the "warming has stopped" claim is that it is simply wrong and repeated without examination. Less kind, some people repeating the claim are ignoring the larger reservoir of ocean heat and the net lost of sea and surface ice during this time, the extended solar minimum, and volcanic aerosols. Therefore, they are being disingenuous.


A fair criticism is that many climate models predicted a greater temperature rise. This is scientifically interesting but not surprising, and this question is being examined in the peer-reviewed science.

In producing the ocean heat widget, Skeptical Science acknowledges that bombs aren't really going off in the ocean; therefore, it's an analogy, not a scientific description. But the analogy is an measure using a unit that is both large enough to describe the quantity of energy at work and within the comprehension of most people who will hear the un-examined claim that global warming has stopped.

By the way, I drew the globe, and I do recognize the the Earth is not truly hollow and filling like a bowl. I hope the metaphor reminds people that the bomb analogy has the qualities of an analogy: not the real description but a useful metric among a population that does not have a ready appreciation for Joules, or other units of energy.

jg

Monday, November 4, 2013

Interactive Climate Science Timeline

I collaborated with a few of the Skeptical Science team to create an interactive timeline of climate science:

Interactive Climate Science Timeline

The timeline is based on a Skeptical Science article on the history of climate science and on illustrations I created. The interactive timeline scrolls left and right through time and has pop-up explanations for various scientific achievements. It's a great place to learn what was known to science as far back as 200 years ago. It can also be embedded in other websites. My contribution is the illustrations that are used as icons and as supplements to the popup articles, such as these from the topics about Milankovitch, Douglas, and Keeling:

Milankovitch


Douglas

Keeling


jg


Tuesday, July 2, 2013

Rock Weathering Post on Skeptical Science

John Mason of Skeptical Science has written an excellent overview of long term rock weathering and how it maintains atmospheric CO2 levels. I contributed a sketch on the post in which I tried to stuff every relevent component of the long term carbon cycle into a width of 560 pixels. I also created larger versions that are available in the Skeptical Science Climate Graphics section.


jg

Climate Comments

In about 50 minutes, one can read a poorly researched opinion letter asserting that climate change is fiction (e.g., PE letter Climate Change a Fiction), do a google search to find NASA's earth temperature data, download the data into Excel, review the formula for a linear trend, calculate the trends for 10-, 30-, and 100-year time periods, jot down the slope of each, noting that all are positive, and then write a rebuttal, which I did. I'm not the only one who felt a letter in the paper is a minimum provocation for a rebuttal (e.g., PE letter Sacrifice to help stall climate change). And I'm probably not the only one who invests more time researching the topic than the orginal writer of an opinion. In the past, I've regretted capturing a permanent link to such conversations, for the papers sometimes clean their wedsites of old comments and old letters. So, this post is mainly for me to stash a recent ill-informed letter where I and anyone interested may find it.

Thursday, June 27, 2013

Upstaged by NASA in Jennifer Francis's Arctic Amplification (Extreme Weather)

Jennifer Francis of Rutgers University has a 1/2 hour talk on YouTube on arctic amplification in which she explains how climate change is affecting our weather. The presentation can be viewed here:
Extreme Weather, by Jennifer Francis

At about 17-18 minutes into the presentation, she uses some animations I created for a post on the jetstream by John Mason, of Skeptical Science. The complete post is here:
http://www.skepticalscience.com/jetstream-guide.html

Both Dr. Francis's presentation and John Mason's article are excellent sources for understanding weather and how long term climate change will affect weather. Specifically, climate change is warming the arctic which changes the behavior of the jetstream which determines our weather.

The must-see item in the presentation, however, is the video she includes from NASA that shows the jetstream in action. This video improves on my schematic, but it was an eerie, pleasant feeling for me to see it after creating animations that depict the same effects.

Unfortunately, the color choice I made for one of the schematics didn't show up well in the video (the animation is projected onto a screen and then captured by a video camera). The original animations can be seen with the Skeptical Science jetstream article (above) and are posted on my website here:

http://www.brightstarstemeculavalley.org/science/jetstream.html

Dr. Francis's video includes the following for more information on climate:

https://www.facebook.com/ClimateState

jg

Friday, June 14, 2013

I had an opportunity to contribute an illustration to Dana Nuccitelli's blog at The Guardian: Climate Concensus - The 97%. Below is a variation of the illustration used, but without the typo.


The illustration in a larger form (also without the known typo) is available from the Climate Graphics section of the Skeptical Science website. I expect to be doing variations of this illustration, as the notion of a consensus is still provocative among those unwilling to face the implications form climate studies. The existence of a consensus, what it is based on, and how that message has been derailed will have to stated and restated if humanity is to unite in time to avert unprecedented rates of global change.

jg


Saturday, May 4, 2013

I contributed a cartoon to a recent post on Skeptical Science (Forks in the Road: Last Exit to Two Degrees):

The Road to Six Degrees

The illustration reflects a common view among climatologists that the longer society waits to cut greenhouse gas emissions, the harder it will be to avoid a warmer planet. The turns in this metaphor are last chances. Every year, humanity is committing itself to an ever warmer world.

I think we've missed the two degree turn, but that's a debatable question. It's a genuine topic of scientific debate as opposed to the false controversy perpetuated by some conservative media, politicians, business interests, and most important, the conservative media's loyal followers. While the false controversy asks "is the planet warming?" "is it natural?", climatologists are debating how much Earth will warm and how that will play out on a world of 9+ billion people who are highly dependent on our climate.

For perspective, the average temperature difference between the last global ice age and now is 6 degrees C. Humanity is on the road to 6 degrees C, but in the warmer direction, a level that has not been seen in over a million years, perhaps many more. Worse, the rate of global change may have no precedent in geological history, but this too, is a valid scientific debate.

I'm ready to jump out of the car.

jg

Wednesday, January 2, 2013

Skeptical Science Post: The Dirt on Climate

I posted an article on Skeptical Science:

http://www.skepticalscience.com/DirtOnClimate.html

My grandmother was always fascinated by knowing that a region in Northern China (the Chinese Loess Plateau) had similar geology and formation history as a region near her home. Both the Chinese Loess Plateau and the loess bluffs that gave Council Bluffs in western Iowa (USA) its name, were formed from windblown dust deposited during times of northern hemisphere glaciations. The Chinese Loess Plateau is exceptional in that Hao et al. (writing in Nature, 18 Oct. 2012) link dust size to weather systems whose strengths correlate to glacial and interglacial conditions. Therefore, they were able to use layers of loess to estimate the extent of previous interglacials.

Perhaps the most rewarding part of examining this research is the opportunity it presented to contact the authors. My summary on Skeptical Science was greatly enhanced by the contribution of photos from Qingzhen Hao of the region he studied.


jg

Wednesday, November 28, 2012

A bright and colorful picture of impending doom and gloom

As global warming heats the arctic faster than the rest of the
world, vast stores of methane and CO2 are likely to be released.
I've contributed an illustration to a post at www.skepticalscience.com
summarizing the mechanisms of greenhouse gas release from the
arctic. My diagram appears in Part 1 of the series:

Subcap Methane Feedbacks, Part 1


Humanity is getting a 2 for the cost of 1 deal on our greenhouse gas
emissions: because the oceans and terrestrial biosphere have been
absorbing half of our emissions, we incur half the environmental
cost of our energy use. Eventually, the ability of the oceans and
biosphere to absorb emissions may become saturated and even
reversed, so that these regions emit greenhouse gases, a process
that's starting in the Arctic.
jg